
How will distance affect sound?
Materials

Figure 1. Set of microphone (2 sets is needed for the experiments-by Hung Vu)

Figure 2. A speaker (by Hung Vu)
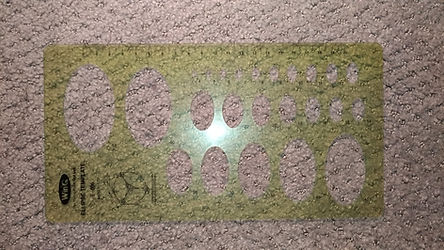
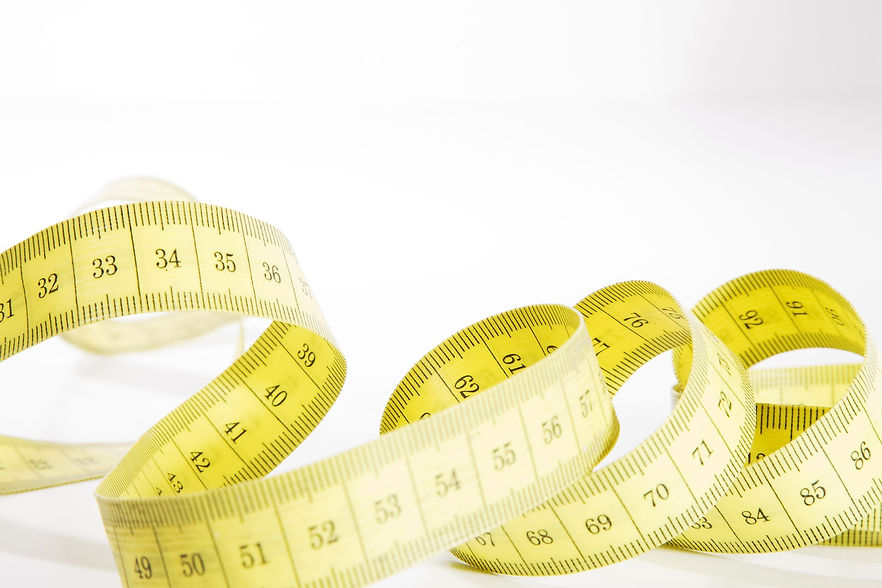
Figure 3. A ruler (by Hung Vu)
What are we suppose to find out?
-
In this experiment, we are going to discover the relationship between distance and sound level, distance and changes in air pressure (or sound pressure) caused by audio source. How and why do we measure sound level in decibel scale. How will sound level and air pressure change if we adjust the distance between ears (microphone) and audio source.
Overall description
-
The first microphone will measure the in nearby atmospheric pressure, including static pressure from air and dynamic pressure, which is the change in pressure.
-
The microphone is zero-ed out so only dynamic pressure is recorded.
-
In this case, a microphone will represent our ears.
-
The second microphone will record sound pressure level in decibel scale.
Note
-
We have learned that sound is created when there are changes in air pressure. Our ears will pick up that change and transmit that signal to our brain, which then interpret the signal to what we call "sound".
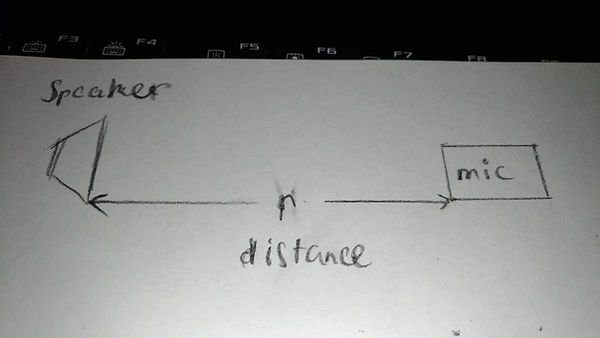
Figure 4. Picture shows an overview of setup (by Hung Vu)

Experiment on relationship between sound pressure and distance
Procedure
-
Let speaker play 1000 Hz pure tone.
-
Using microphone to record changes in pressure caused by 1000 Hz tone at 6 different distance.
-
Adjust the distance between microphone and speaker and record the value again.
Note
-
The microphone will record in only 0.03 seconds to avoid any changes in sound caused by environment (reflection, dispersion, et cetera).
-
Because the microphone records in 0.03 second, with 1000 Hz tone (1000 crests in 1 second) we will have 30 crests in graph. Take the average amplitude of those 30 crests to attain the final value for air pressure at that position.
See the picture on the right for more information.

crests
Amplitude at specific time, search for crest's respective amplitude in here
Figure 5. Graph shows shows sound pressure over time of 1000 Hz pure tone (by Hung Vu)
Result

Figure 6. Graph shows relationship between sound pressure and distance between microphone and a speaker (by Hung Vu)
Description and Analysis
The changes in air pressure is recorded at 6 different distance (1 cm, 2 cm, 3 cm, 4 cm, 5 cm, 6 cm) as shown in graph. The best fit line is inversely curved, which means sound (air) pressure will decrease if we increase the distance. This implies the relationship between two values is inversely proportional. This can be proved by the fact that the best fit line will never cross x and y axis. When the distance becomes really small (near zero), sound pressure will be infinitely high, and vice versa.
From the graph, we have the equation: y = 0.4218 * x ^ -1.083
where y is sound pressure (Pa), x is distance between microphone and speaker (cm).
From the equation, we realize: y ~ 1/x
Ignoring the constant (duo to inaccuracy in measurement, we will discuss it later), in other word, their relationship is: P = 1/r
where P is sound pressure (Pa), r is distance between microphone and speaker (cm).
In reality, unit of distance for sound measurement is always in meter (m). However, because we only consider the ratio of distance, it can still be measure in centimeter. However, we have to keep every measurement in centimeter so the unit can be canceled out later on.

Experiment on relationship between sound pressure in decibel scale and distance
Procedure
-
Use recorded sound pressure at certain distance from experiment above.
-
Calculate the ratio between recorded sound pressure and reference sound pressure (recorded sound pressure / reference sound pressure).
-
Calibrate second microphone manually, then use it to record sound pressure level in decibel scale.
-
Create a graph showing relationship between sound pressure level in decibel scale and ratio between recorded sound pressure, reference sound pressure to show how sound pressure is recorded in decibel scale.
-
Use (4) to explain the relationship between distance and sound pressure level in decibel scale.
Note
-
Reference sound pressure indicates threshold of hearing at 1000 Hz. In other words, sound from 1000 Hz pure tone must creates sound pressure with amplitude of Reference sound pressure at minimum in order to let a normal person hear the sound.
-
Reference sound pressure = 0.0002 Pa

Sound pressure level in decibel scale
Figure 7. Measurement of sound pressure in decibel scale (by Hung Vu)
Result

Figure 8. Graph shows relationship between sound pressure and ratio of recorded sound pressure to reference sound pressure (by Hung Vu)
Description and analysis
Sound pressure is recorded at 6 different distances, from left to right (6 cm, 5 cm, 4 cm, 3 cm, 2 cm, 1 cm). The best fit line is a non-linear line, but its overall shape is nearly linear, which means sound pressure in decibel scale will increase if the ratio between recorded sound pressure and reference air increase.
This specific best fit line is chosen duo to the fact that the rate of change of data change quickly when we adjust the distance between microphone and audio source. This shape implies that the relationship between two values is logarithmic.
From the graph, we have equation: y = 7.4744ln(x) + 9.8884
where y is sound pressure in decibel scale (dB), x is ratio between recorded sound pressure and reference sound pressure.
Ignoring the constant 9.8884 duo to inaccuracy of measurement, which we will discuss later. Now what we have is: y = 7.4744ln(x)
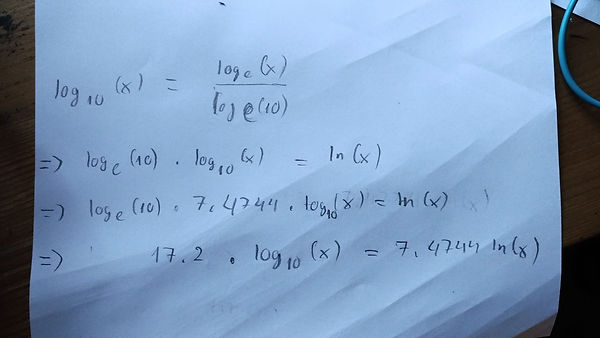
This time, we will change this equation to log base 10 (see in the picture below).
Based on this conversion, now what we have is: y = 17.2 * lg(x)
In reality, the relationship between y and x is : y = 20 * lg(x)
In other words: B = 20 * lg(P/P_reference)
where B is sound pressure level (dB), P is recorded sound pressure (Pa), P_reference is reference sound pressure (Pa).
The coefficient we have is 17.2, while the real coefficient is 20, so we have 14% error here (we will discuss the inaccuracy of measurement later).
How sound pressure level changes when we adjust distance between audio source and microphones?
Figure 9. The conversion of equation from natural to common log (by Hung Vu)
We have learned these 2 equations
P = 1 / r
and
B = 20 * lg(P/P_reference)
From these, we can figure out the relationship between r and B (see in the picture below).
This picture showing the change in sound pressure level if we decrease the distance by a half.
When we decrease the distance by a half, sound pressure level will increase by 6 dB.
This tells us that whenever we change the distance by a factor of 2, either increasing or decreasing, sound pressure level will change by 6 dB compared to previous distance.

Figure 10. Proving the relationship between sound pressure level in decibel scale and distance (by Hung Vu)
-
In the first experiment (sound pressure vs. distance), the distance is measured by ruler manually. This will create errors duo to the inaccuracy of ruler (the deviation is not perfect), the inaccuracy of measuring by hand.
-
In second experiment, we used results from the first one so it also involves errors from the first experiment.
-
The two experiments uses different sets of microphone, both of them can't record data perfectly duo to limit of devices (specification). Besides, Although microphone in second experiment is calibrated, it is done manually so it cannot match with first set of microphone.
-
Since 2 sets of microphone are different, that's why there is 14% error in our final equation.
-
Largest source of uncertainty is limitation of devices in general, and calibration of second microphone set in particular.